
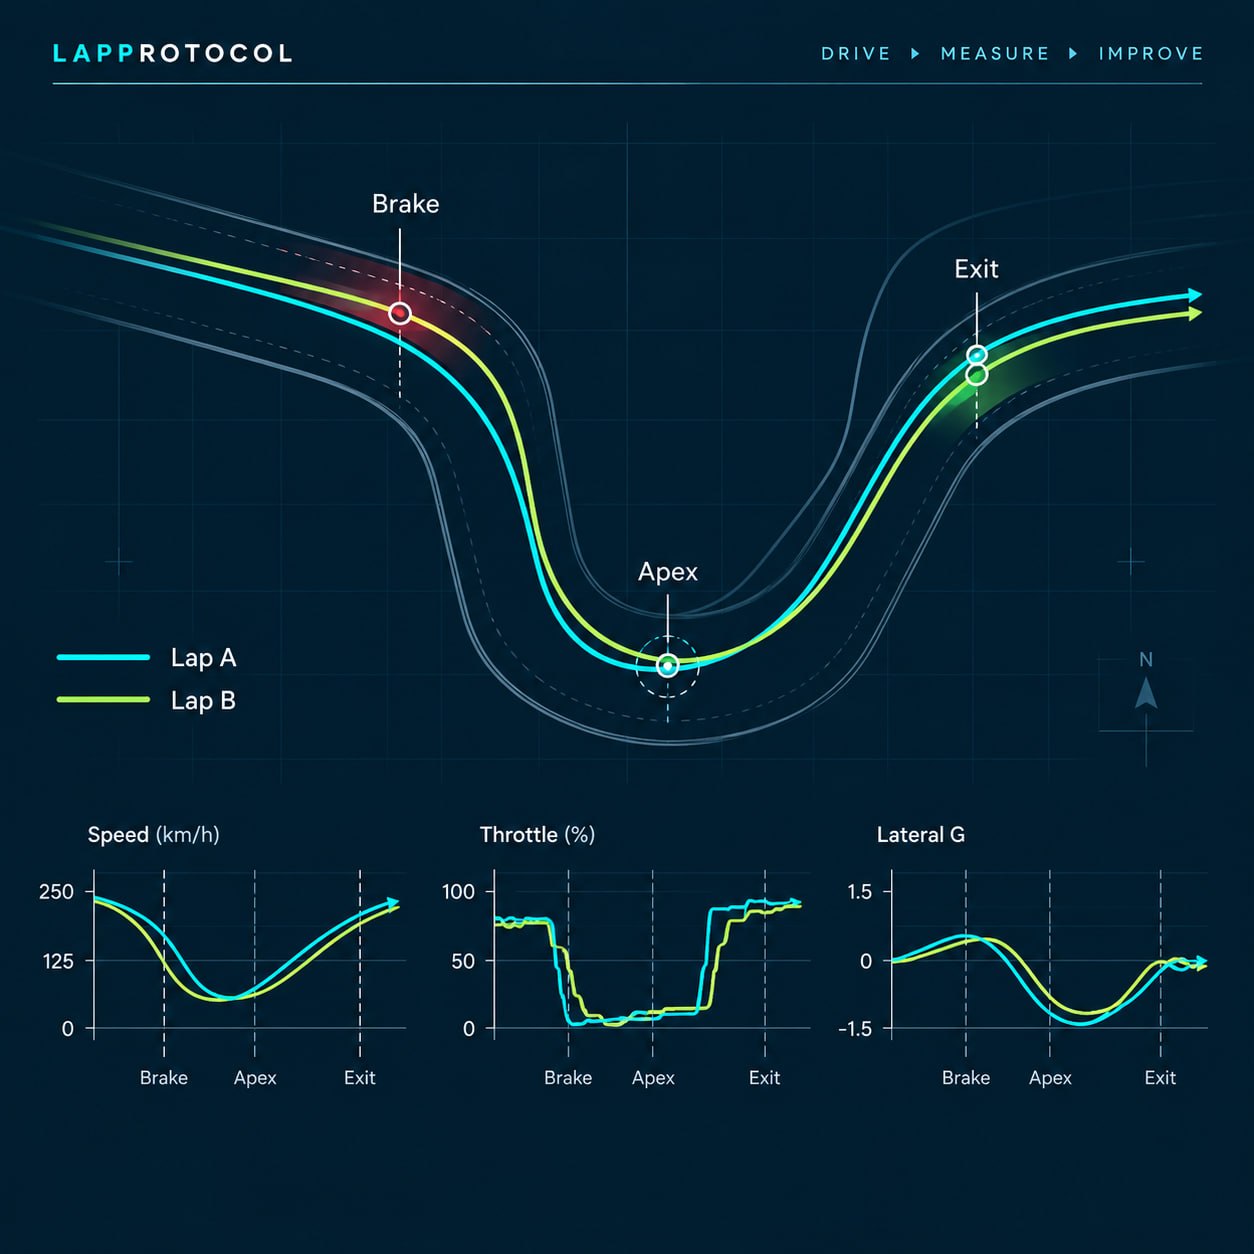
Two lap times give you a result, not an explanation. A faster lap may have gained time in one braking zone, lost it in the next corner and recovered some of the difference on a straight. It may also have benefited from clearer traffic, a different tyre state or a cleaner line. Treating the final number as a verdict on every action in the lap is a quick way to learn the wrong lesson.
A better comparison follows one principle: compare segments and driver inputs, not just final lap time. Use the time difference to find where to look, then compare the sequence of inputs and vehicle response that surrounds that change. Finish with one hypothesis and one next test.
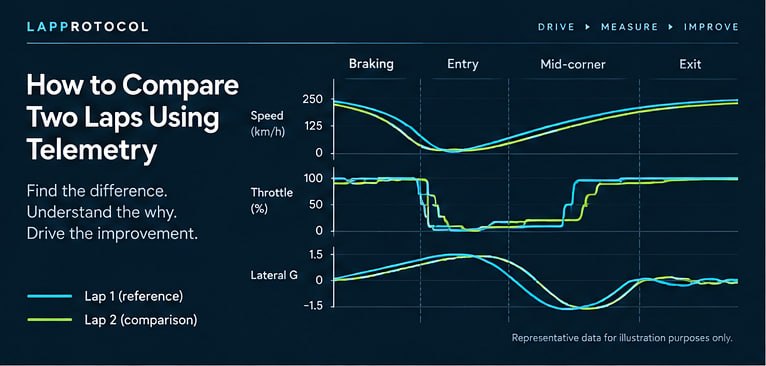
Two lap times tell you little by themselves
Choose a reference lap and a comparison lap deliberately. The reference might be the faster lap, but it could also be the more representative lap if the faster one contains traffic, a missed apex or an unusual exit. Name them plainly, such as Lap A and Lap B, and write down which one is faster before opening the traces.
The first question is not “which trace looks better?” It is “what exactly changed?” A final lap difference can be divided across many places. If a lap is 0.4 seconds faster, that does not mean the driver was 0.4 seconds better everywhere. The gain may be concentrated in one segment, while another part became slower.
Keep the comparison at the level the data can support. If the logger has reliable lap timing but no steering or brake channel, do not write a detailed conclusion about steering or brake release. Missing data is not a zero, and a smooth-looking trace is not proof that the underlying signal is valid.
Make sure the laps are comparable
Before interpreting a delta, confirm the laps belong to the same circuit and layout. Check the start and finish definition, direction of travel, timing beacon or GPS reference, and whether the analysis system has aligned the laps correctly. A layout change, an incorrectly placed start line or a poor synchronisation point can make a precise-looking comparison meaningless.
Then check the session context. Record, where available:
- traffic, yellow flags, overtakes or a lift caused by another car
- weather, track temperature, damp patches and changing surface conditions
- tyre model, condition, warm-up state and pressures recorded by a consistent method
- fuel, passenger or other load changes
- session order, cool-down laps and red-flag interruptions
- logger configuration, GPS quality and any missing or clipped channels
The cold-to-hot tyre-pressure method is useful when tyre state is part of the context, because it keeps a measured record separate from an assumed target.
Confirm lap validity as well. Look for a complete trace, sensible start and finish, no obvious dropouts, and the same number of meaningful timing sectors if the system supplies them. If the data does not establish that the laps are comparable, label the conclusion as uncertain and find a better pair before changing the car.
Start with where the time changed
Start with cumulative delta or segment time. Cumulative delta shows how the time difference develops as the car travels around the lap. Segment time shows the difference within a defined portion. Either view can answer the first useful question: where did Lap B move ahead of or behind Lap A?
This is a locating tool, not a diagnosis. A delta says that elapsed time changed between two positions. It does not prove whether the cause was braking, line, grip, traffic, throttle timing, a timing artefact or a combination of factors.
Find the first substantial separation, then check what happens immediately afterwards. A gain at corner entry may be given back on exit. A slower apex may lead to a stronger exit and a net gain down the following straight. A change in one corner can compromise the next segment, so do not score each isolated trace without looking at the linked section.
Choose one corner or segment
Do not begin by comparing the entire lap at once. Select one corner or one linked segment where the delta changed clearly. Define its boundaries in a repeatable way, such as braking onset to the point where the car is fully on the following straight. The exact boundaries depend on the circuit and the data, but they should remain the same for both laps.
Use the same distance or time reference for both laps. If the software allows markers, place them at braking onset, initial steering, brake release, turn-in, apex region, throttle reapplication and exit. These are comparison landmarks, not universal targets. A marker that is useful at one corner does not become a prescription for another car or circuit.
Compare braking and entry
Start with the approach. Compare speed before braking, the point at which braking begins, the rate of deceleration if available, and the speed carried toward turn-in. Later braking is not automatically faster. It can reduce the distance available to settle the car, force a sharper direction change or compromise the exit.
Next compare how the braking phase ends. Brake release and turn-in are often connected, but they are not the same event. Ask whether one lap keeps meaningful brake input later, releases it earlier, or changes the release rate while steering begins. Then check the response: speed, steering, yaw, lateral acceleration and path where those channels are available.
A later release accompanied by a better exit may be a useful hypothesis. It is not proof that later release is the answer. The faster lap may have approached differently, had a different tyre state, or used a line that made the release possible. The data identifies a sequence to test, not a universal braking rule.
The corner-entry understeer diagnosis describes the same discipline from the handling side: distinguish driver input, vehicle response, context and setup hypotheses before changing the car. A lap comparison can sharpen that observation, but it cannot turn one trace into a mechanical diagnosis.
Read minimum speed carefully
Minimum speed is attractive because it is easy to quote. It is also easy to misuse. A higher minimum speed may indicate a stronger corner, but it may also mean the driver ran wide, accepted a poor exit or measured a different point in the corner. A lower minimum speed may be the result of a deliberate sacrifice that produces more acceleration afterwards.
Check where the minimum occurred, not only its value. Compare the speed trace before and after it, the steering and brake sequence, the path, and the next segment time. Ask whether the car was rotating, still decelerating, or already positioned for exit. The minimum is one event in a sequence, not a score for the whole corner.
If the path is available, use it to understand context rather than to declare millimetre-accurate truth. GPS resolution, antenna placement, update rate, smoothing and alignment can all limit the usefulness of a path comparison. A visible difference may be real, but the trace should be treated as an aid to a hypothesis and checked against driver view, notes and repeated laps.
Compare throttle and exit
Compare the first throttle application, how quickly it increases, whether it is interrupted, and how speed builds after the apex. Earlier throttle is not automatically better. If it causes a correction, wheelspin, understeer or a compromised line, the apparent gain at the first application may disappear before the next braking point.
Look at the exit as a linked section. A driver who reports “had to wait before throttle” may have experienced a late rotation, a wide entry, a bump, a loss of confidence or a real traction limitation. Speed, brake release, throttle and path can narrow those possibilities, but they do not replace the driver’s description.
If gear and RPM are available, use them to explain acceleration context. A shift, limiter event or different gear can change the speed trace without being a cornering improvement. Wheel speeds can help identify differences between vehicle speed and individual wheel behaviour, but their interpretation depends on the sensors, tyre slip and channel definitions. Do not infer more than the installation can support.
Use several channels together
The available channel list depends on the logger, sensors, vehicle integration, configuration and software. Official documentation from MoTeC’s i2 downloads page and Race Technology’s analysis software page is product-specific. Neither supports a claim that every logger provides every signal or every analysis view.
Where supported, useful channels may include:
- speed, which describes the vehicle’s progress through the segment
- throttle position, which describes the driver’s power request
- brake pressure or brake state, depending on the installation
- steering angle, if measured or supplied by the vehicle
- lateral and longitudinal acceleration
- yaw rate
- wheel speeds
- GPS position or path
- gear and engine RPM
Keep provenance visible. A directly measured channel may come from a sensor. A CAN or vehicle channel may be supplied by the car’s electronics. GPS-derived data comes from the positioning system. A calculated channel may be produced from other signals by the logger or analysis software. These categories have different limitations, and the channel label does not guarantee accuracy.
Read signals as a sequence. For example, if Lap B shows a later brake release, check whether steering begins at the same distance, whether yaw responds similarly, whether minimum speed moves, and whether exit throttle improves. If only one channel changes, the reason may be a sensor/signal issue, a synchronisation issue or a data-alignment issue. If several channels change together, the pattern is more interesting, but correlation is still not causation.
Bring driver feedback back into the analysis
Telemetry does not replace driver feedback. It gives the feedback a more precise place in time and distance. Write the driver’s note before reviewing the trace where possible. “Had to wait before throttle” is more useful than a generic “slow exit” because it describes an experience that can be checked against brake release, speed, throttle, path and repeated laps.
Also record what the driver was trying to do. “Turned in at the usual point but missed the apex” asks a different question from “turned in late because the car felt unstable.” The same speed trace can be produced by different intentions and different corrections.
Review more than one occurrence. A single lap can contain a mistake. A repeated note across comparable laps is stronger evidence of a pattern, although it still does not prove one cause. If the driver report and trace disagree, preserve the disagreement and check alignment, channel definitions, camera view and context.
Common lap-comparison mistakes
- Comparing laps from different layouts or timing definitions.
- Treating the faster whole lap as proof that every action on it was better.
- Calling a cumulative delta a diagnosis rather than a location of time change.
- Assuming later braking, higher minimum speed or earlier throttle is always faster.
- Reading speed without checking brake, steering, path and the following segment.
- Treating one channel as enough to diagnose grip, balance or a mechanical fault.
- Treating GPS path as millimetre-accurate truth.
- Ignoring traffic, weather, tyre state, fuel, load, track state or data quality.
- Changing several inputs or setup variables and then claiming to know what worked.
- Treating representative teaching data as a real test result.
- Assuming a software product or logger has channels that were not actually configured.
Turn the comparison into one next test
End the review with a sentence that could be tested. A useful format is: “In this segment, Lap B lost time after turn-in while brake release and steering changed together. On the next comparable run, I will test a smoother release while keeping entry speed and line as consistent as practical, then review exit speed and the following segment.”
That is a hypothesis, not a promise. Define the evidence that would support or weaken it before the run. Keep the change small enough to attribute the result. If the test changes driving input, stay within the driver’s safe margin and event conditions. If it changes the vehicle, follow the relevant manufacturer, component and event requirements.
After the next run, compare the same segment and linked exit rather than moving the goalposts to final lap time alone. A test can be useful even if the lap is not faster, because it may reject a hypothesis.
Practical checklist
Before comparing:
- Same circuit, layout, direction and timing definition.
- Lap validity and synchronisation checked.
- Traffic, weather, tyre, fuel, load and track context recorded.
- Available channels and their provenance confirmed.
During analysis:
- Cumulative delta or segment time used to locate the change.
- One corner or linked segment selected.
- Braking, release, turn-in, minimum speed, throttle and exit reviewed as a sequence.
- Several available channels compared together.
- GPS path treated as contextual, not perfect truth.
- Driver feedback checked against the data.
For the next test:
- One hypothesis written in plain language.
- One input or controlled change selected.
- The comparison conditions and success evidence defined.
- The same segment and following section scheduled for review.
Sources and methodology
This article uses a small source set for product-documentation context only. The official documentation supports product-specific features such as overlays, graph comparison, run comparison, track maps and configured channel or variable views. The explanation of how to compare segments, interpret delta and combine data with driver feedback is LapProtocol editorial methodology. It is not a software review, does not claim hands-on testing, and does not recommend a telemetry product. Product capabilities and channel availability must be checked against the actual logger, vehicle integration, configuration and software version.
The methodology page provides the broader data-plus-driver-feedback context. Keep the distinction clear: documented software information describes what a product or manual says, while the comparison method here is a conditional editorial framework. It cannot establish causation from one lap or replace inspection, manufacturer guidance or competent technical advice.
Representative teaching data — not a real vehicle test. The figure in this article is explanatory material only. It is not attributed to a real driver, car, circuit, logger or software package, and it supplies no performance result or input target.